

Straight line graphs Part 2
This tutorial follows on from “Working with a coordinate grid” and “Straight line graphs Part 1“. We’ve covered the basics of straight line graphs – enough to get you up to about Grade 3/4 level at GCSE – and now we’re going to take it a step further.
If you want to jump ahead to Part 3 then you can find that here.
You might find it helpful to print out this sheet, which has six coordinate grids on it, that you can use to practise plotting your straight line graphs, and to work out the answers to questions in this tutorial. You’ll find the coordinate grids useful for other graph work too.
If you don’t have access to a printer then you can draw your own coordinate grids out on squared paper.
Don’t forget to always use a ruler for when you are plotting a straight line graph, and label each line with its equation!
There are some activities to work through in this tutorial, with the answer to each step given if you scroll down a little, so for maximum benefit, try to do each part before you scroll down and reveal the answer.
Recap of key points covered so far
A graph is a picture showing the relationship between two algebraic variables – we usually use x going across and y going up, but any letters can be used.
A line with the equation x = k (where k is a constant) will always be vertical and will cross the x-axis at k.
A line with the equation y = k will always be horizontal and will cross the y-axis at k.
If the equation of a straight line graph is given in the form y = mx + c then
- The c (the number on its own) is the y-intercept, i.e. the number on the y-axis where the graph crosses it.
This is also the value of y when x is 0, since any graph crosses the y-axis when x = 0 (and vice versa). - The m (the number multiplied by the x) is the gradient, i.e. how many units the graph goes up by, for each unit to the right. (The x is not part of the gradient!)
If you have these two pieces of information then you can plot, or sketch, a straight line graph without always having to make a table of values and plot all the points.
For example, line y = 2x + 3 will cross the y-axis at 3 and will have a gradient of 2, i.e. it goes up 2 units for every 1 unit to the right.
And the line y = 1 – 4x can be thought of as y = -4x + 1, so it crosses the y-axis at 1 and has a gradient of -4, i.e. it goes DOWN 4 units for every 1 to the right.
More on that later in this tutorial.
Finding the equation of a straight line from its graph
Finding the gradient
You can find the gradient of a straight line graph – i.e. the “m” in your equation y = mx + c – by drawing a gradient triangle.
- Choose two points on the graph where it’s easy to read the coordinates. They should be as far apart as possible.
- Draw a right-angled triangle going across from the lower one and then up to the higher one.
- Work out the length of each of these lines.
- Divide the vertical length (the rise) by the horizontal length (the run or tread)
Here are two examples:
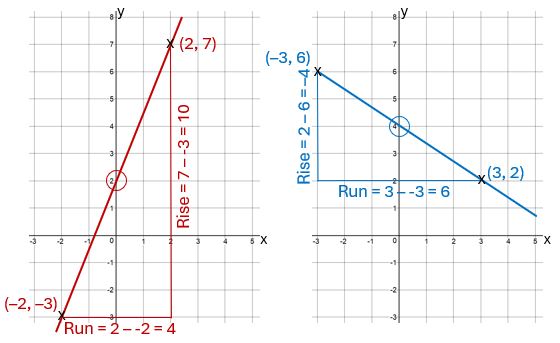
For the red line shown above, let’s use the points (-2, -3) and (2, 7). (Any two points on the line will do but you’ll get a more accurate reading if they’re a long way apart – important if you’re taking the gradient of a straight line graph showing, for example, the results of an experiment.)
The “rise” is the vertical distance from -3 to 7, which is 10 units,
and the “run” or “tread” is the horizontal distance from -2 to 2, which is 4 units.
So the gradient is  or 2.5.
For the blue line, we’ll use (-3, 6) and (3, 2). Notice that this line goes down from left to right, so the gradient will be negative.
The “rise” is the distance from 6 down to 2, so it’s -4,
and the “run” is from -3 across to 3, which is 6.
So the gradient is  (best to leave it as a fraction).
Finding the y-intercept
If you can see where the line crosses the y-axis then you can simply read off that value and it gives you the “c” for your y = mx + c.
On the two examples above, the y-intercepts are circled. Before you scroll any further, can you predict what the equations of the two lines will be?
Answers:
Red line: m = 2.5 and c = 2 so the equation is 
Blue line: m =  and c = 4 so the equation is
  , or
, or 
If you can’t see where the line crosses the y-axis then you have to use a point on the line, together with the gradient, to work it out.
For example, let’s imagine we have a line that disappears off the bottom of our grid before reaching the y-axis, but it has a gradient of 2 and passes through the point (8, -3). This tells us that m is 2, and when we put an x-coordinate of 8 into the equation of the line then it will give us a y-coordinate of -3.
So the equation
y = mx + c
becomes
-3 = 2 × 8 + c.
We can solve this equation to find c:
-3 = 16 + c
-3 – 16 = c
c = -19
So the equation of the line is y = 2x – 19.
Your turn 1
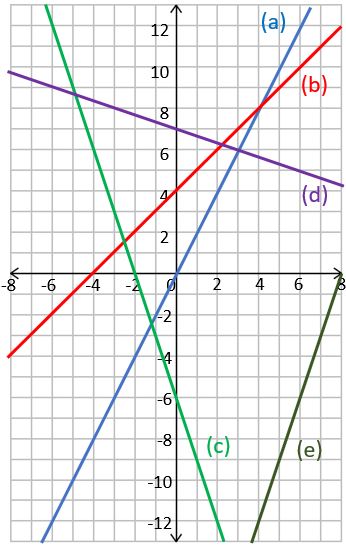
Find the equation of each line of this grid, in the form y = mx + c.
Finding the equation of a straight line graph without seeing the graph
In fact you can find the equation of any line, using the method we used in the last example above, if you know its gradient and the coordinates of any point on the line.
For example, if you know that the gradient is 4 and the line goes through (2, 5) then we can work out c by substituting the values of m, x and y into the straight line equation:
y = mx + c
5 = 4×2 + c
5 = 8 + c
5 – 8 = c
c = -3
So the equation is y = 4x – 3.
If you’re given the coordinates of two points on the line then you can find the gradient first and then use the same approach.
Example:
Find the equation of the line that passes through the points (2, 3) and (4, 7).
Gradient m 
(You could use  and get the same answer – just make sure you put the same coordinate point first both top and bottom, otherwise your gradient will end up witht he wrong sign.)
Then we can use either of the coordinate pairs to find c:
y = mx + c
becomes
3 = 2×2 + c (using 2, 3)
or
7 = 2×4 + c (using 4, 7)
and the solution to both of those equations is c = -1
so the equation of the line is y = 2x – 1.
Your turn 2
A) Find the equation of the straight line graph that
- has a gradient of 5 and goes through the point (2, 7)
- has a gradient of
 and goes through the point (4, -1)
B) Find the equation of the straight line graph that goes through the points
- (1, 3) and (5, 11)
- (3, 5) and (–2, 10)
- (–2, 3) and (4, 1)
Sketching a straight line graph
When you plot a graph, you have to be accurate. However, to sketch a graph, you don’t need – or even want – a grid with accurate divisions; you only want your sketch to show the general shape and important features of the graph.
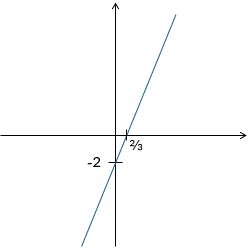
As an example, let’s sketch the graph of y = 3x – 2.
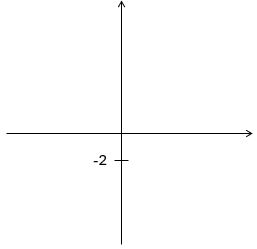
Start by drawing a set of axes, but don’t put any numbers on them (except maybe a 0 at the origin).
We know that the graph crosses the y-axis at -2, which is below the x-axis, so we can mark and label -2 on the y-axis.
We also know that, since the gradient is 3, the graph goes up 3 units for every single unit to the right, so that’s a fairly steep upward slope. Draw it in:
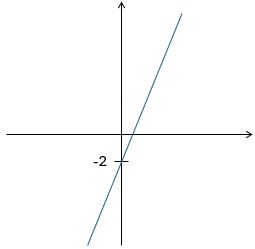
… And that’s your graph sketch.
If you’re asked to show all intercepts with the axes then you also need to work out where the graph crosses the x-axis, and label that.
The key thing to remember here is that any graph crosses the y-axis when x = 0, and crosses the x-axis when y = 0.
Since we want to know where it crosses the x-axis, we need to substitute in y = 0 and solve to find the corresponding x-value:
0 = 3x – 2
2 = 3x
x = 
So this graph crosses the x-axis at .
Other forms of the straight line equation
Sometimes you’ll see the equation of a straight line given in different forms. If you want to know the gradient and y-intercept then you need to rearrange it into y = mx + c form.
For example:
2y = 6x – 3
does not have a gradient of 6!
Divide through by 2 to make the y the subject:
y = 3x – 1.5
So the gradient of this straight line graph is 3.
Here’s another one:
3x + 2y = 6
2y = 6 – 3x
y =  (6 – 3x)
y = 6 –  x (or – x + 6)
So the y-intercept is 6 and the gradient is – or -1.5,
i.e. the line goes down by 3 for every 2 units to the right, or down by 1.5 for every 1 to the right.
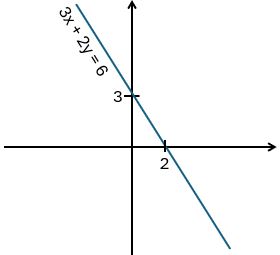
But if you only want to know what the graph looks like then, with this particular format (ax + by = c), you can use the “cover-up method”:
3x + 2y = 6
Remember, any graph crosses the y-axis when x = 0, and crosses the x-axis when y = 0.
When x = 0, 3x = 0 so the 3x disappears. Cover it up and you’re left with 2y = 6, so y = 3.
So the graph crosses the y-axis at 3.
When y = 0, 2y = 0 so the 2y disappears. Cover it up and you’re left with 3x = 6, so x = 2.
So the graph crosses the x-axis at 2.
Mark in these two points on your graph and draw a straight line going through them both. Finished!
Your turn 3
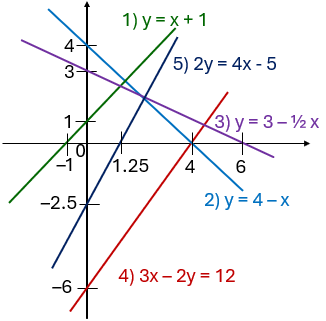
Sketch these straight line graphs, showing where they cross both axes. Also find the gradient of each one.
(You don’t need to draw all the graphs on the same set of axes, but if you want extra challenge then give it a try! Make sure that the intercepts on each axis are in the right order and the the gradients make sense – a gradient of 2 has to be steeper than a gradient of 1 – and don’t forget to label each line with its equation!)
- y = x + 1
- y = 4 – x
- y = 3 – x
- 3x – 2y = 12
- 2y = 4x – 5
The only things left to cover for Foundation GCSE now are parallel lines and finding the coordinates of a mid-point. These, and the additional content that you need for Higher Tier, will be covered in the next tutorial in this series.

If you’ve found this article helpful then please share it with anyone else who you think would benefit (use the social sharing buttons if you like). If you have any suggestions for improvement or other topics that you’d like to see covered, then please comment below or drop me a line using my contact form.
On my sister site at at mathscourses.co.uk you can find – among other things – a great-value suite of courses covering the entire GCSE (and Edexcel IGCSE) Foundation content, and the “Flying Start to A-level Maths” course for those who want to get top grades at GCSE and hit the ground running at A-level – please take a look!
If you’d like to be kept up to date with my new content then please sign up to my mailing list using the “Subscribe here” form at the bottom of this page, which will also give you access to my collection of free downloads.
Your turn 1 – answers
a) y = 2x (+ 0)
b) y = x + 4
c) y = –3x – 6
d) y = –⅓x + 7
e) y = 3x – 24
Click here to return to questions
Your turn 2 – answers
A)
- y = 5x – 3
- y = –½ x +1 or 1 – ½ x
B)
- y = 2x + 1
- y = –x + 8 or 8 – x
- y = –⅓ x + 2⅓
Click here to return to questions
Your turn 3 – answers
- Gradient m = 1
- Gradient m = -1
- Gradient m =
- Gradient m = or 1.5
- Gradient m = 2
Click here to return to questions