
Working with a coordinate grid
In this tutorial we’re looking at working with a coordinate grid: what it looks like, terminology and plotting points, and the equations of simple vertical and horizontal lines. Once you’re comfortable with this basic content, you can move on to the next tutorial, which covers plotting straight lines with different y-intercepts and gradients, and understanding what the equation of a straight line tells you.
There are some activities to work through, with the answer to each step given if you scroll down a little, so for maximum benefit, try to do each part before you scroll down and reveal the answer.
Coordinate grid basics
You might like to start by downloading and printing out this sheet. It has six coordinate grids on it, that you can use to practise plotting points and lines, and to work out the answers to questions in this tutorial. You’ll find the coordinate grids useful for other graph work too.
If you don’t have access to a printer then you can draw your own coordinate grids out on squared paper.
This video from my Grade 4 Essentials course covers the same material as the first section of this article. It also starts off a little more slowly, initially dealing with only positive coordinates, so if you find the written version a bit daunting then this might be easier to digest!
The coordinate grid and plotting points
Look at the grid below. The horizontal line with the numbers on it is called the x-axis and the vertical line is the y-axis. Each point on the graph is described by a pair of coordinates (x, y). You always start at the point where the two axes cross; this is the point (0, 0), also called the “origin”. The x-coordinate tells you how far to go horizontally to the right, and the y-coordinate tells you how far to go up, to get to the point you want.
So the red x labelled as “A” is the coordinate point (3, 2) – i.e. 3 to the right and 2 up. Always plot points with crosses, not blobs – you need to be accurate!
It might help you to think “x is a cross so we go across, and y’s up (wise up)”. Also remember that x comes before y in the alphabet so the x-coordinate always comes first in a coordinate pair.
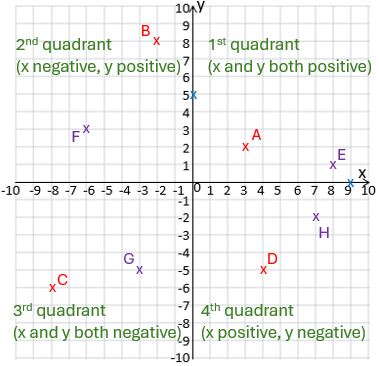
You can see that the two axes divide the grid into four sections; these are called “quadrants”. In the first quadrant, both the x- and y-coordinates are positive. When we go into the second quadrant, we are to the left of the origin (and of the y-axis) so the x-coordinates are negative. The coordinates of point B are (-2, 8), because we’ve gone 2 to the left, or -2 to the right, and then 8 up.
In the third quadrant we’ve gone below the origin (and the x-axis) so now the y-coordinates are also negative. To get from the origin to point C we go 8 to the LEFT (or -8 to the right) and 6 DOWN (or -6 up) so its coordinates are (-8, -6).
In the fourth quadrant we’re back to having positive x-coordinates, but the ys are still negative.The coordinates of point D are (4, -5).
We also have two points plotted on the axes in blue. To get to the one on the horizontal (x-) axis we go 9 to the right and don’t need to go up at all, so its coordinates are (9, 0). For the one on the vertical (y-) axis, we don’t go across at all and we go up 5, so the coordinates are (0, 5).
Your turn 1
- Work out the coordinates of points E, F, G and H (plotted in purple on the grid above).
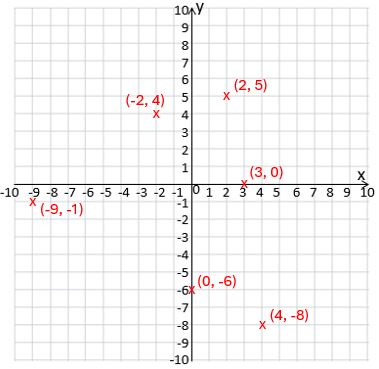
- On one of your own coordinate grids, plot these points and label each one with its coordinates:
(2, 5)
(3, 0)
(4, -8)
(-2, 4)
(0, -6)
(-9, -1)
Vertical and horizontal lines
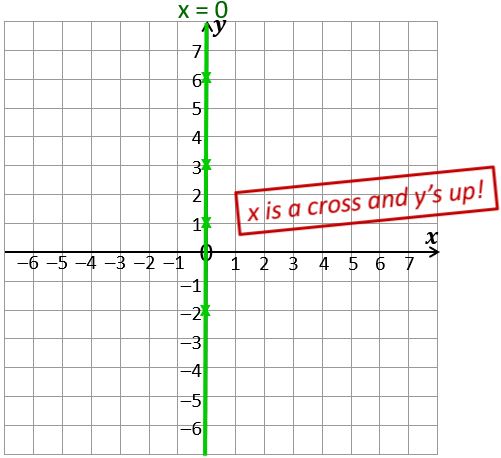
What do the coordinate pairs (0, 1), (0, 3), (0, 6) and (0, –2) all have in common?
Answer: They all have an x-coordinate of 0.
Now plot those points on a new coordinate grid. What can you say about the pattern they make?
Do it before you scroll any further!
Answer: They’re all in a straight line going up the y-axis.
In fact if you join them all up (and extend the line at both ends) then you get a straight line graph that is the locus of all points with an x-coordinate of zero. Since x=0 at every single point on this line (including the bits where the y-coordinate isn’t a whole number), we call this “the line x = 0” and say that “x = 0” is the equation of the line.
Of course that means it’s also another name for the y-axis, because every point on the y-axis has an x-coordinate of 0.
So where would the line with equation x = 2 be? Try to draw it on your own grid. If you’re not sure, try plotting a few points with an x-coordinate of 2, for example (2, 0), (2, 3), (2, -5). The answer is just below – try not to scroll down and see it until you’ve tried to do it yourself!
And don’t forget to use a ruler for your straight line!
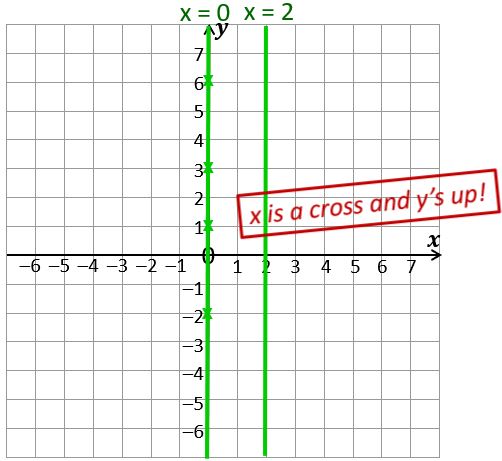
Don’t forget to label each line with its equation.
Now, can you draw the line whose equation is y = 0? You can use the same grid, or a new one if you prefer.
Answer: All the points with a y=coordinate of 0 are on the x-axis, so “the line y = 0” is another name for the x-axis.
How about y = -3? Try to draw the straight line graph – not forgetting to label your line – before scrolling down to see the solution!
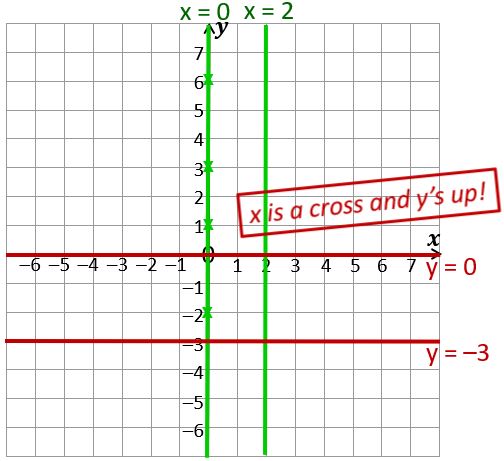
So the line x = k (where k is any constant) is always vertical, and the line y = k is always horizontal.
Your turn 2
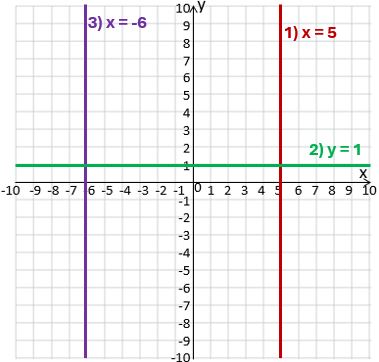
Plot the graphs of:
- x = 5
- y = 1
- x = -6
I hope you’re feeling more confident now about working with a coordinate grid that you did at the top of the page!
The next tutorial in this series covers plotting straight lines with different y-intercepts and gradients, and understanding what the equation of a straight line, in the form y = mx + c, tells you.

If you’ve found this article helpful then please share it with anyone else who you think would benefit (use the social sharing buttons if you like). If you have any suggestions for improvement or other topics that you’d like to see covered, then please comment below or drop me a line using my contact form.
On my sister site at at mathscourses.co.uk you can find – among other things – a great-value suite of courses covering the entire GCSE (and Edexcel IGCSE) Foundation content, and the “Flying Start to A-level Maths” course for those who want to get top grades at GCSE and hit the ground running at A-level – please take a look!
If you’d like to be kept up to date with my new content then please sign up to my mailing list using the “Subscribe here” form at the bottom of this page, which will also give you access to my collection of free downloads.
Your turn 1 – answers:
E = (8, 1); F = (-6, 3); G = (-3, -5); H = (7, -2)
Click here to return to questions
Your turn 2 – answers
Click here to return to questions