
Hypothesis testing for pmcc (A-level Maths)
This is the third of my series of three articles on hypothesis testing for A-level Maths, and covers hypothesis testing for pmcc (the product moment correlation coefficient).
The first instalment introduced the concept of hypothesis testing and covered hypothesis testing for a binomial distribution, and can be found here; the second covered hypothesis testing for the mean of a normal distribution and can be found here.
You might be surprised to learn that hypothesis testing for pmcc, although usually the last to be covered, is actually the simplest.
Hypothesis testing for pmcc
The purpose of hypothesis testing
A hypothesis test for pmcc is to establish whether the correlation found in a sample indicates that correlation is likely to exist in the population as a whole.
For example, a survey of a random sample of 30 adults from a particular region might show a positive correlation between head circumference and score in an IQ test, with a pmcc of 0.57. We can use a hypothesis test to ascertain whether this means that correlation between head circumference and IQ test result probably exists across the entire population of that region.
How it works – basic principle
H0 is the null hypothesis, which is the assertion that there is no correlation in the population as a whole. Just as  is used to represent the product moment correlation coefficient for an observed sample, the equivalent Greek letter
  (lowercase rho) is used for the pmcc of the whole population (similar to using
  and the Greek
  (lowercase mu) respectively for a sample mean and the population mean of a distribution).
So when we’re testing for pmcc, the null hypothesis is always that  , i.e. that there is no correlation in the population as a whole.
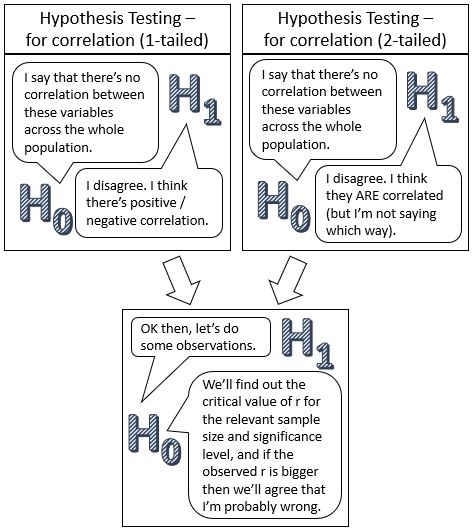
H1 is the alternative hypothesis, which is the assertion that the correlation does exist in the population as a whole. If the hypothesis specifies whether the correlation is positive ( ) or negative (
 ) then it’s a 1-tailed test; if not – effectively H1 is sitting on the fence and not committing either way – then it’s a 2-tailed test where
  .
.
We use tables to look up the critical value of that would indicate correlation in the population as a whole, and compare it with the pmcc of the observed sample. If the magnitude of the observed pmcc is greater than the critical value then the result is significant, so we reject H0 and accept that correlation probably does exist across the whole population.
Note: Because it’s all based on a balance of probabilities, you can never make a definitive statement that yes, correlation does exist in the population, only that it’s likely that it does. Therefore the question is always whether we reject H0, not whether we accept H1.
The critical value
Of course, the smaller the sample, the higher the critical value of ; if you only have six items in your sample then you’re much more likely to observe a correlation in your sample where none exists in the whole population, than if you had a sample of 60. And the significance level also affects the critical value: a lower value of α means a more demanding test and therefore a higher critical value.
Edexcel provides a table (on page 37 of the formula booklet) for you to look up the critical value; see extract below. AQA doesn’t provide such a table, but when they’ve asked questions on hypothesis testing for pmcc they’ve included a few values so that you still had to identify the right one. I’m not sure which approach OCR takes to this topic.
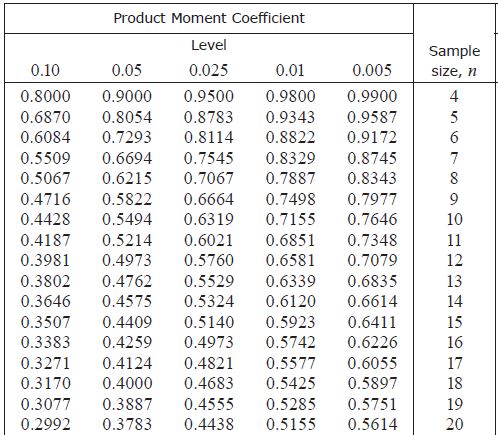
For example, if you had a sample size of 12 and a significance level of 5% then the critical value would be 0.4973, so if the magnitude of the observed sample’s pmcc was greater than this then you’d reject H0.
As with other hypothesis tests, the significance level is also the probability of incorrectly rejecting H0. This is because although it may be probable that correlation exists in the population as a whole, it is still possible that it doesn’t.
Hypothesis testing for pmcc: Method
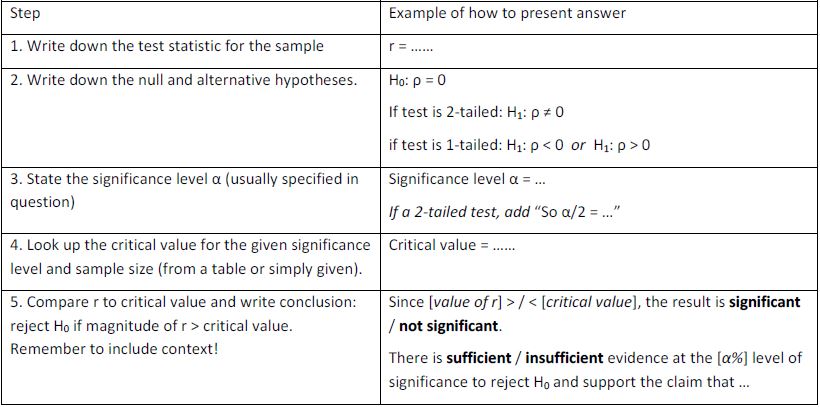
The writing frame below shows you how to present your answer to a question on hypothesis testing for pmcc. (Scroll down for a plain text version.) You can get a free printable copy – as well as other useful downloads – if you sign up to my mailing list – see this page.
Writing frame (plain text version: p-value method)
- Write down the test statistic, , for the sample
- Write down the null and alternative hypotheses.
- State the significance level α. If it’s a 2-tailed test then use half of this value.
- Look up the critical value for the given significance level and sample size
- Compare to the critical value and write conclusion: reject H0 is magnitude of > critical value. Remember to include context!
- Since [value of ] < / > [critical value of α or < α/2 as appropriate], the result is significant / not significant. There is sufficient / insufficient evidence at the [α%] level of significance to reject H0 and support the claim that …
- Since [value of
Example
For a data sample of 10 items showing a pmcc of -0.69 between BMI (body mass index) and walking speed, carry out a hypothesis test to ascertain
(a) at the 1% level of significance, whether correlation exists in the population as a whole;
(b) at the 5% level of significance, whether negative correlation exists.
(The model solutions below use the writing frame above.)
Solution to (a)

H0:
H1: [This is a 2-tailed test since the direction is not specified]
Significance level α = 0.01 but test is 2-tailed so use 0.005
From the table, critical value = 0.7646
Since |-0.69| < 0.7646, the result is not significant.
Conclusion: There is insufficient evidence at the 1% level of significance to reject H0 and support the claim that there is correlation between BMI and walking speed in the population as a whole.
Solution to (b)
H0:
H1: [This is a 1-tailed test since the direction is specified]
Significance level α = 0.05
From the table, critical value = 0.5494
Since |-0.69| < 0.5494, the result is significant.
Conclusion: There is sufficient evidence at the 5% level of significance to reject H0 and support the claim that there is negative correlation between BMI and walking speed in the population as a whole.
Your turn
The height and average length of sleep of 12 adults is measured and the pmcc calculated as 0.52. Carry out hypothesis tests to ascertain
(a) at the 10% level of significance, whether there is positive correlation in the population;
(b) at the 5% level of significance, whether correlation exists in the population as a whole.
Work through the writing frame, using the example solution above as a model, then check your answers by clicking on the link below.
That covers all the hypothesis testing you need for A-level Maths.

If you’ve found this article helpful then please share it with anyone else who you think would benefit (use the social sharing buttons if you like). If you have any suggestions for improvement or other topics that you’d like to see covered, then please comment below or drop me a line using my contact form.
On my sister site at at mathscourses.co.uk you can find – among other things – a great-value suite of courses covering the entire GCSE (and Edexcel IGCSE) Foundation content, and the “Flying Start to A-level Maths” course for those who want to get top grades at GCSE and hit the ground running at A-level – please take a look!
If you’d like to be kept up to date with my new content then please sign up to my mailing list using the “Subscribe here” form at the bottom of this page, which will also give you access to my collection of free downloads.
Answers:
Your turn (a)

H0:
H1: [This is a 1-tailed test since the direction is specified]
Significance level α = 0.10
From the table, critical value = 0.3981 (for n=12 and α=0.10)
Since 0.52 > 0.3981, the result is significant.
Conclusion: There is sufficient evidence at the 10% level of significance to reject H0 and support the claim that there is positive correlation between height and length of sleep in the population as a whole.
Your turn (b)
H0:
H1: [This is a 2-tailed test since the direction is not specified]
Significance level α = 0.05 but test is 2-tailed so use 0.025
From the table, critical value = 0.5760 (for n=12 and α=0.025)
Since 0.52 < 0.5760, the result is not significant.
Conclusion: There is insufficient evidence at the 5% level of significance to reject H0 and support the claim that correlation between height and length of sleep in the population as a whole.
Click here to return to question